
Chapter – 4 : Market Structure Explained Market Trends, BOS, CHoCH & Trade Opportunities
Chapter – 4 : Market Structure Explained Market Trends, BOS, CHoCH & Trade Opportunities
If Support and Resistance (Chapter 2) are the alphabet of technical analysis, then Market Structure is the grammar. It is the foundational backbone of price action. Rather than moving randomly, asset prices expand and retract in continuous cycles dictated by supply and demand.
By reading market structure correctly, traders eliminate guesswork. You can identify the true directional trend of the market, evaluate whether a trend is healthy or exhausting, and recognize precisely when a trend has reversed.
1. Anatomy of Market Structure: The 4 Core Swing Points
Market structure is defined by the relationship between consecutive Swing Highs (peaks) and Swing Lows (troughs). Every market phase is composed of combinations of these four core swing points:
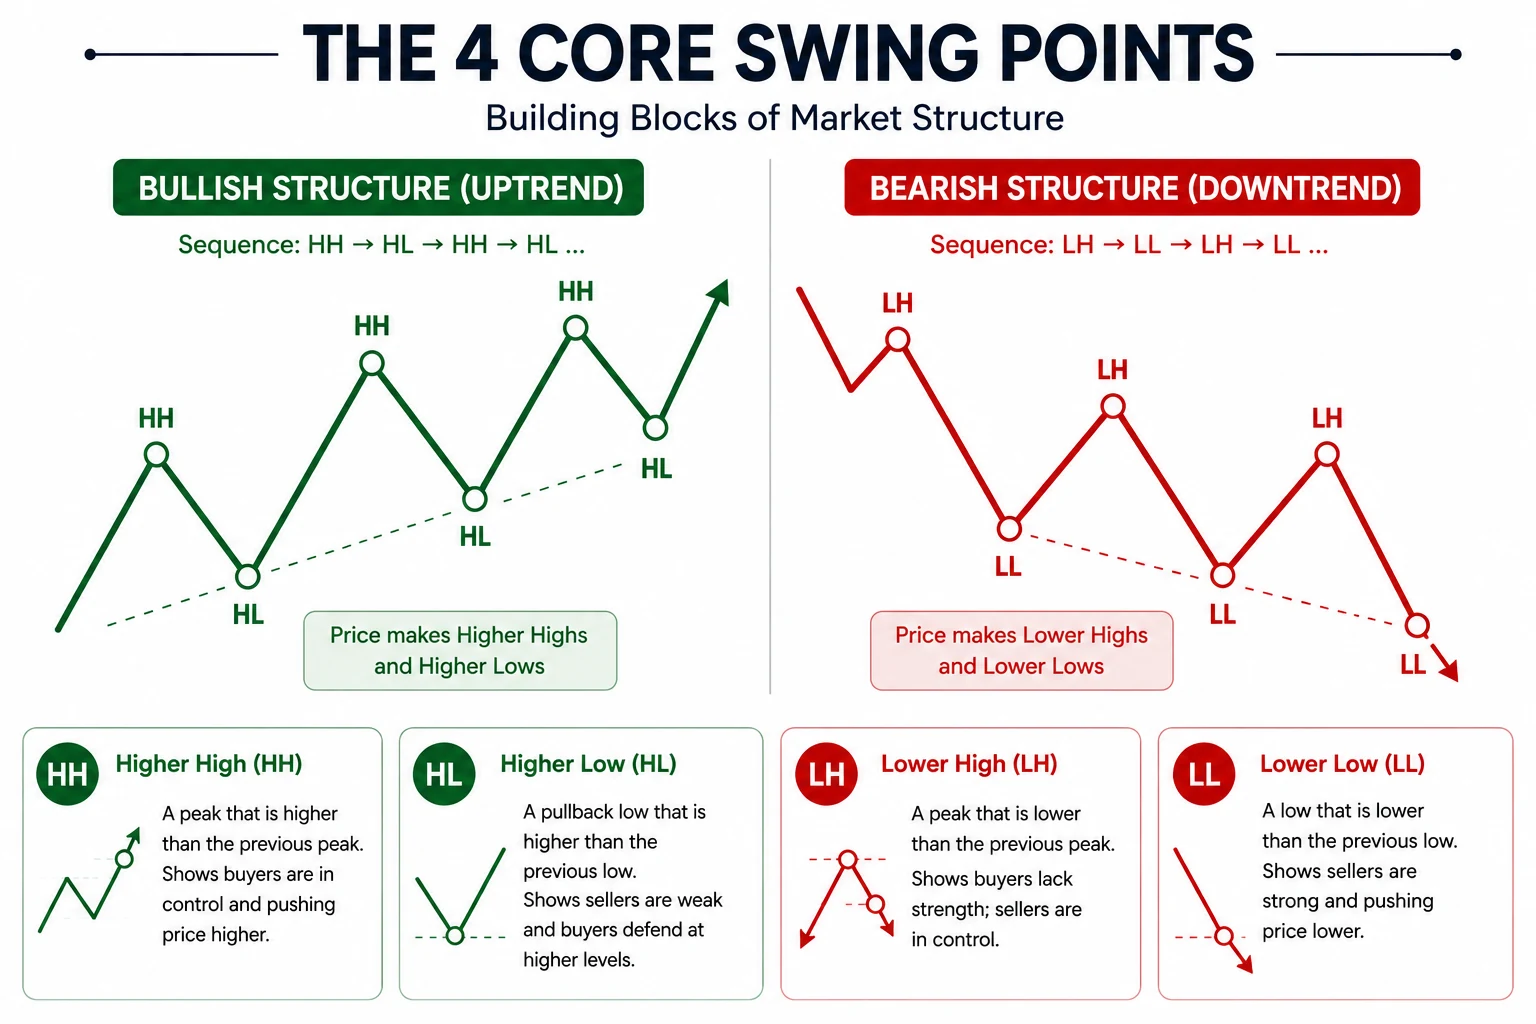
- Higher High (HH): A peak in an uptrend that exceeds the price level of the previous peak. It confirms that buyers successfully pushed price to new relative highs.
- Higher Low (HL): A pullback trough in an uptrend that remains above the previous trough. It shows that sellers were unable to push price lower before buyers stepped back in to defend the level.
- Lower High (LH): A temporary bounce peak in a downtrend that fails to reach the height of the previous peak. It shows that buyers lack the strength to push price back up, allowing sellers to regain control.
- Lower Low (LL): A trough in a downtrend that breaks below the previous trough. It confirms that sellers successfully drove price to new relative lows.
2. The 3 Structural Market Phases
Based on those four swing points, the market is always in one of three structural phases:
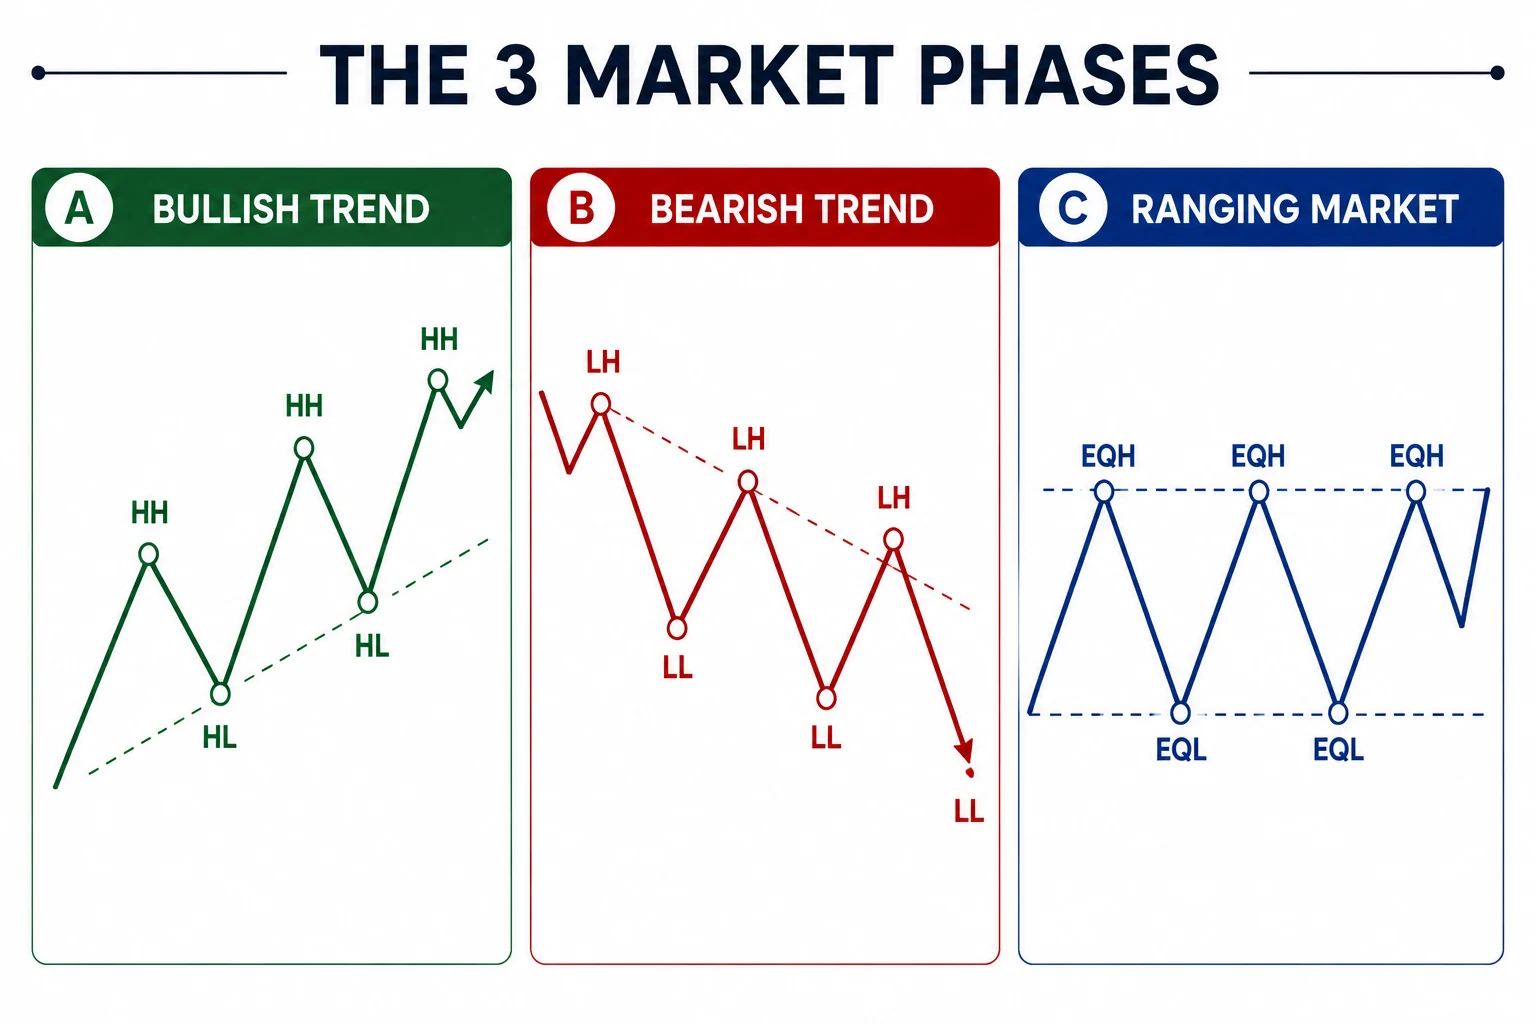
A. Bullish Market Structure (Uptrend)
- Rule: Price forms a continuous sequence of Higher Highs (HH) and Higher Lows (HL).
- Market Logic: Demand dominates supply. Sellers are forced to yield at progressively higher prices on every pullback.
B. Bearish Market Structure (Downtrend)
- Rule: Price forms a continuous sequence of Lower Highs (LH) and Lower Lows (LL).
- Market Logic: Supply dominates demand. Buyers are defeated at progressively lower prices on every rally.
C. Ranging Market Structure (Consolidation)
- Rule: Price trades between horizontal Equal Highs (EQH) and Equal Lows (EQL).
- Market Logic: Supply and demand are balanced within established boundaries before initiating a new directional move.
3. Break of Structure (BOS): Trend Continuation
A Break of Structure (BOS) occurs when price aggressively breaks through a key swing high in an uptrend or a key swing low in a downtrend, closing beyond it with strong momentum.
The Golden Rule of BOS: A valid BOS is confirmed by candle body closes beyond the swing point, not just wick sweeps. A wick poking above a high without a body close often indicates a temporary liquidity sweep (a fakeout) rather than a true Break of Structure.
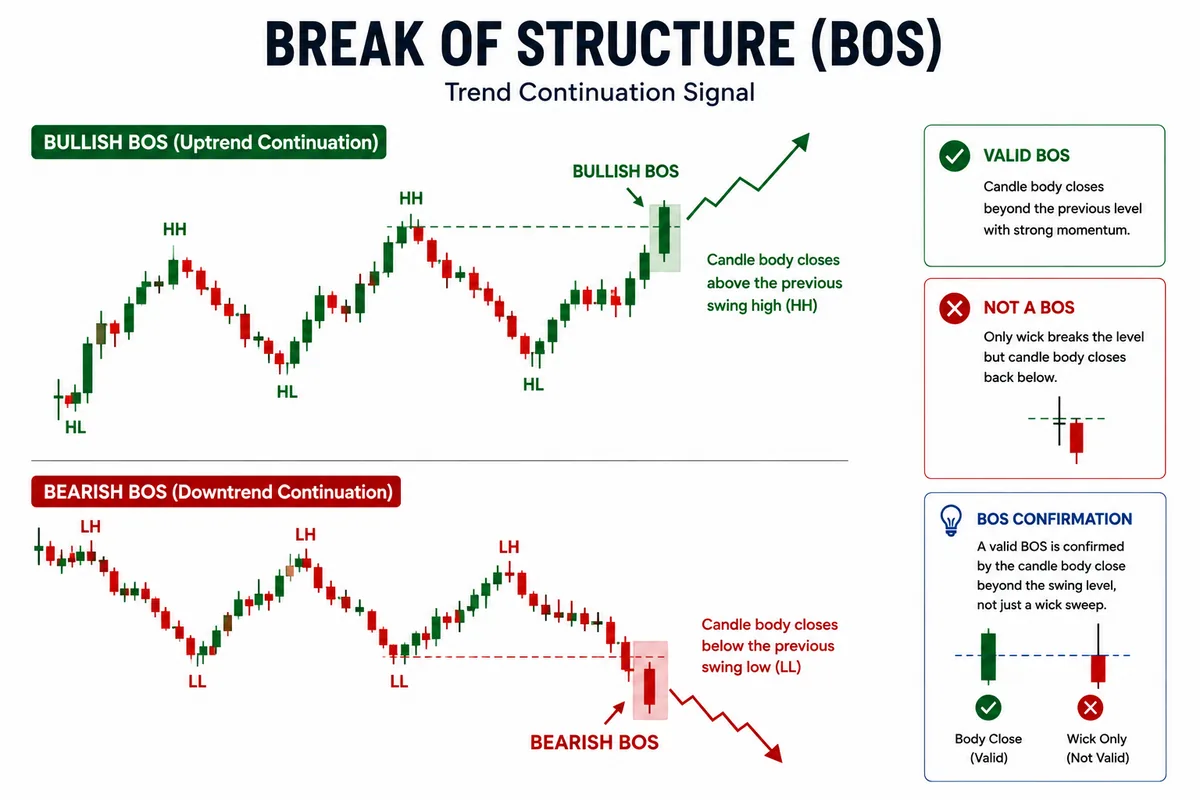
- Bullish BOS: Price closes above the previous Higher High (HH), confirming uptrend continuation.
- Bearish BOS: Price closes below the previous Lower Low (LL), confirming downtrend continuation.
4. Change of Character (CHoCH): Trend Reversals
A Change of Character (CHoCH)—also referred to as a Market Structure Shift (MSS)—is an early technical signal that an existing trend has broken down and a potential market reversal is taking place. A CHoCH occurs when price fails to maintain its structural sequence and breaks the key protective swing point.
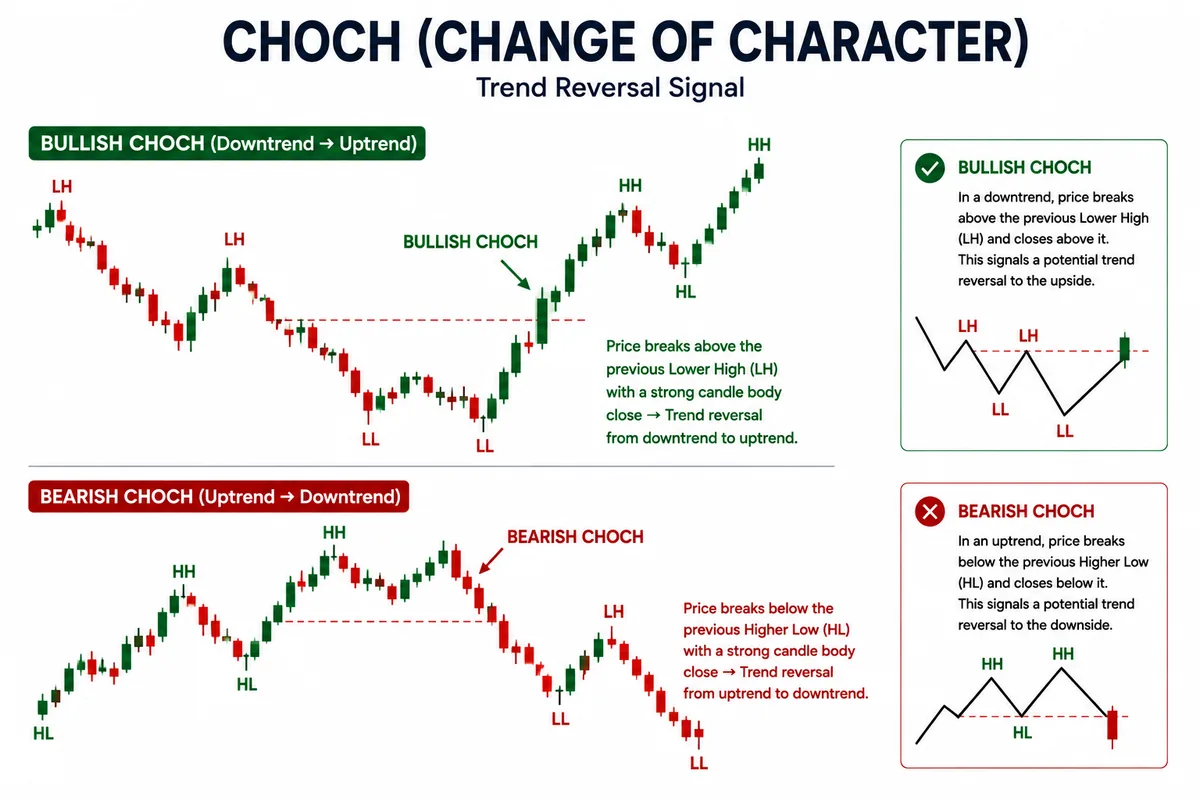
- Bullish to Bearish CHoCH: An uptrend is printing HHs and HLs. Suddenly, price falls and closes below the most recent Higher Low (HL). This invalidates the bullish sequence, signaling sellers have taken control.
- Bearish to Bullish CHoCH: A downtrend is printing LHs and LLs. Suddenly, price surges and closes above the most recent Lower High (LH). This invalidates the bearish sequence, signaling buyers have taken control.
5. Major Structure vs. Minor Internal Structure
A common source of confusion for beginners is failing to distinguish between Major Timeframe Structure and Minor Lower-Timeframe Structure. Not all CHoCHs are created equal.
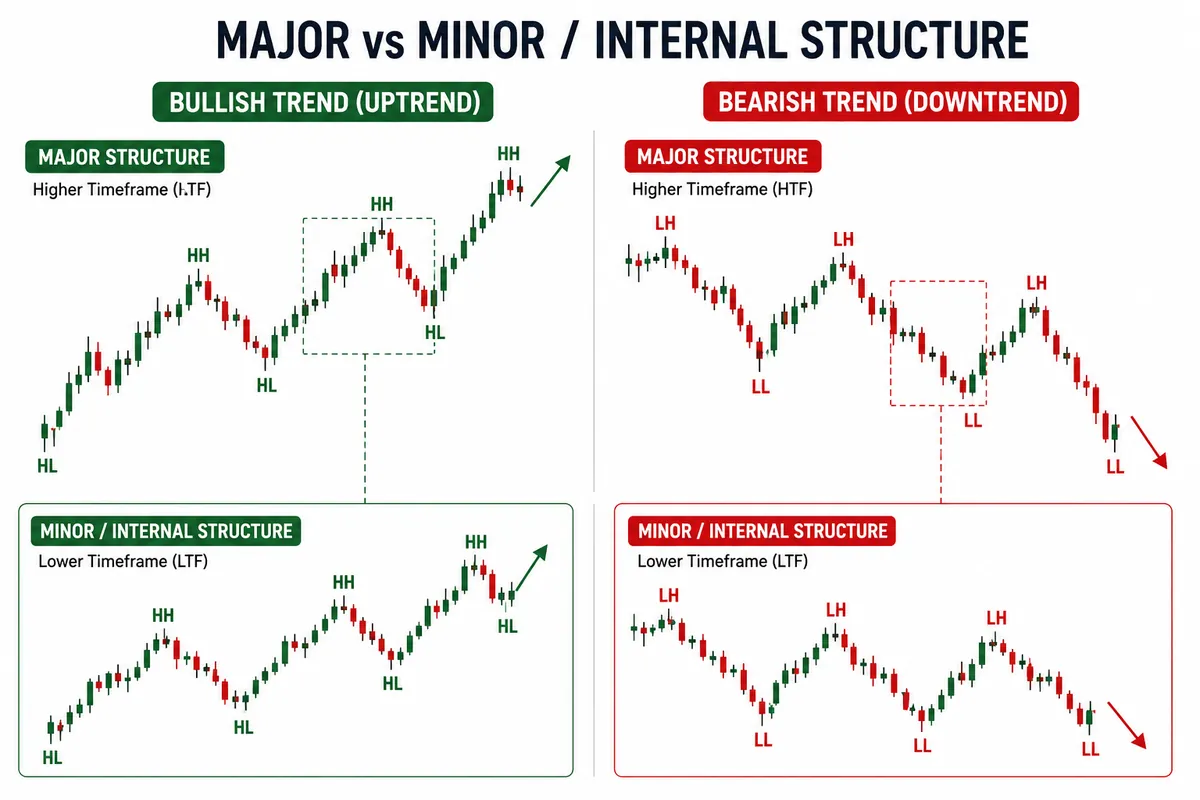
- Major Structure (H4 / D1): Defines the macro trend direction and overall market bias.
- Minor / Internal Structure (M15 / M5): The sub-waves that form inside a major leg. A lower timeframe CHoCH is often just a minor pullback forming a major Higher Low (HL), rather than a full market reversal.
Key Takeaway: Always evaluate minor structural moves in the context of major higher-timeframe levels.
6. Identifying Trade Opportunities Using Market Structure
In price action analysis, structural swing points serve as reference areas for understanding where market opportunities present themselves, where risk is defined, and where potential targets lie.
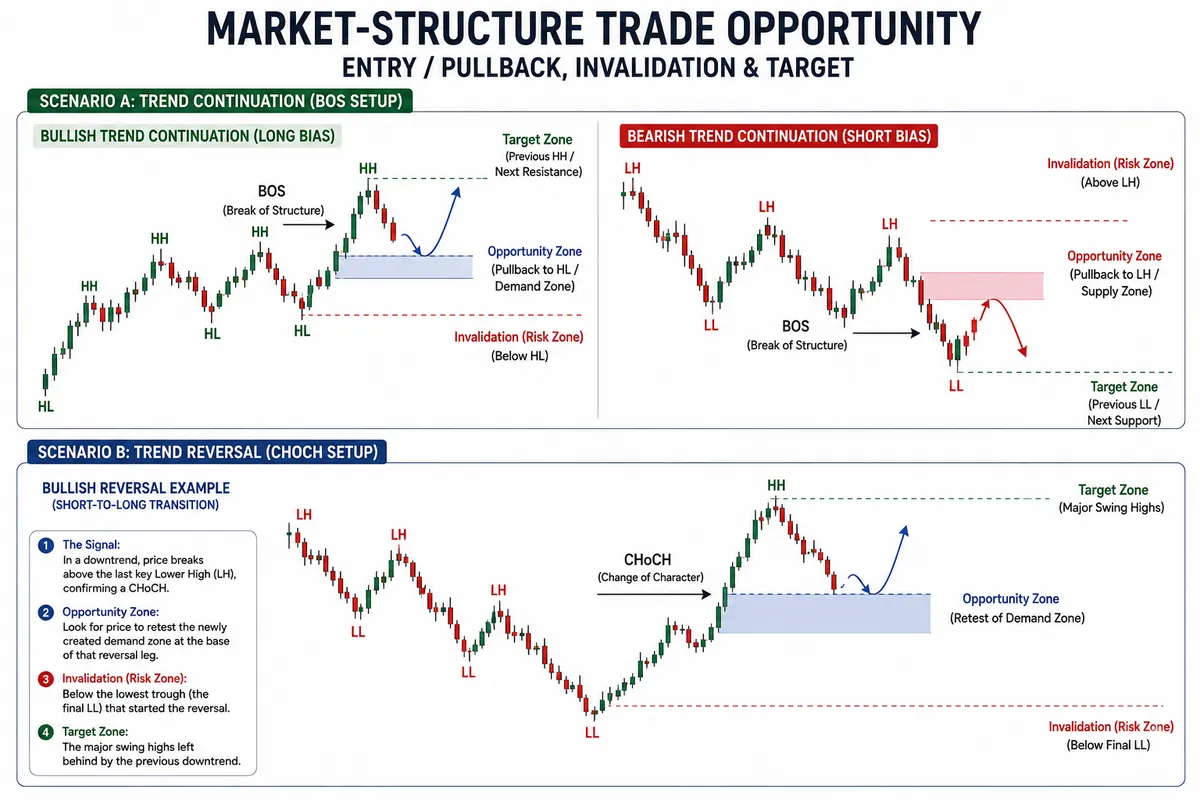
Scenario A: Trend Continuation (BOS Setup)
When a market is trending, buying at the very peak of a breakout carries high risk. Instead, technical analysis focuses on patience—waiting for price to pull back after a Break of Structure.
- Bullish Trend Continuation (Long Bias):
- Opportunity Zone: After a bullish BOS, look for long opportunities when price pulls back toward the newly formed Higher Low (HL) or a demand zone near the origin of the move.
- Invalidation (Risk Zone): The trade is invalidated if price breaks below the protective HL.
- Target Zone: The previous Higher High (HH) or next major resistance.
- Bearish Trend Continuation (Short Bias):
- Opportunity Zone: After a bearish BOS, look for short opportunities when price rallies back into the Lower High (LH) or a supply zone.
- Invalidation (Risk Zone): Invalidated if price pushes back above the protective LH.
- Target Zone: The previous Lower Low (LL) or next major support.
Scenario B: Trend Reversal (CHoCH Setup)
A Change of Character allows traders to identify early shift opportunities before a full new trend is widely recognized.
- Bullish Reversal Example (Short-to-Long Transition):
- The Signal: In a downtrend, price breaks above the last key Lower High (LH), confirming a CHoCH.
- Opportunity Zone: Look for price to retest the newly created demand zone at the base of that reversal leg.
- Invalidation (Risk Zone): Below the lowest trough (the final LL) that started the reversal.
- Target Zone: The major swing highs left behind by the previous downtrend.
7. Structural Reference Summary
| Concept | Market Condition | Key Observation Point | Invalidation (SL) | Target (TP) |
|---|---|---|---|---|
| BOS Continuation (Long) | Active Uptrend | Pullback to HL / Demand | Below the HL | Recent HH |
| BOS Continuation (Short) | Active Downtrend | Rally to LH / Supply | Above the LH | Recent LL |
| CHoCH Reversal | Trend Exhaustion | Origin area of shift | Beyond final swing point | Next key structural level |
Summary Key Takeaways
- Four core swing points: Uptrends are formed by HH + HL; Downtrends are formed by LH + LL.
- BOS confirms continuation: A body close past a swing point in the direction of the trend signals that the trend remains intact.
- CHoCH signals potential reversal: A structural break against the prevailing trend is the first sign of a market shift.
- Structure defines risk: Protective swing points (HL in an uptrend, LH in a downtrend) act as logical invalidation areas for your Stop Loss.