
Chapter – 2 : Support and Resistance Levels Explained
Chapter – 2 : Support and Resistance Levels Explained
If technical analysis is a language, Support and Resistance are its alphabet. Everything else—trend lines, chart patterns, and indicators—is built on top of these two concepts. They represent key horizontal price levels on a chart where the forces of supply (sellers) and demand (buyers) meet, causing price movement to pause, bounce, or completely reverse.
1. What Are Support and Resistance?
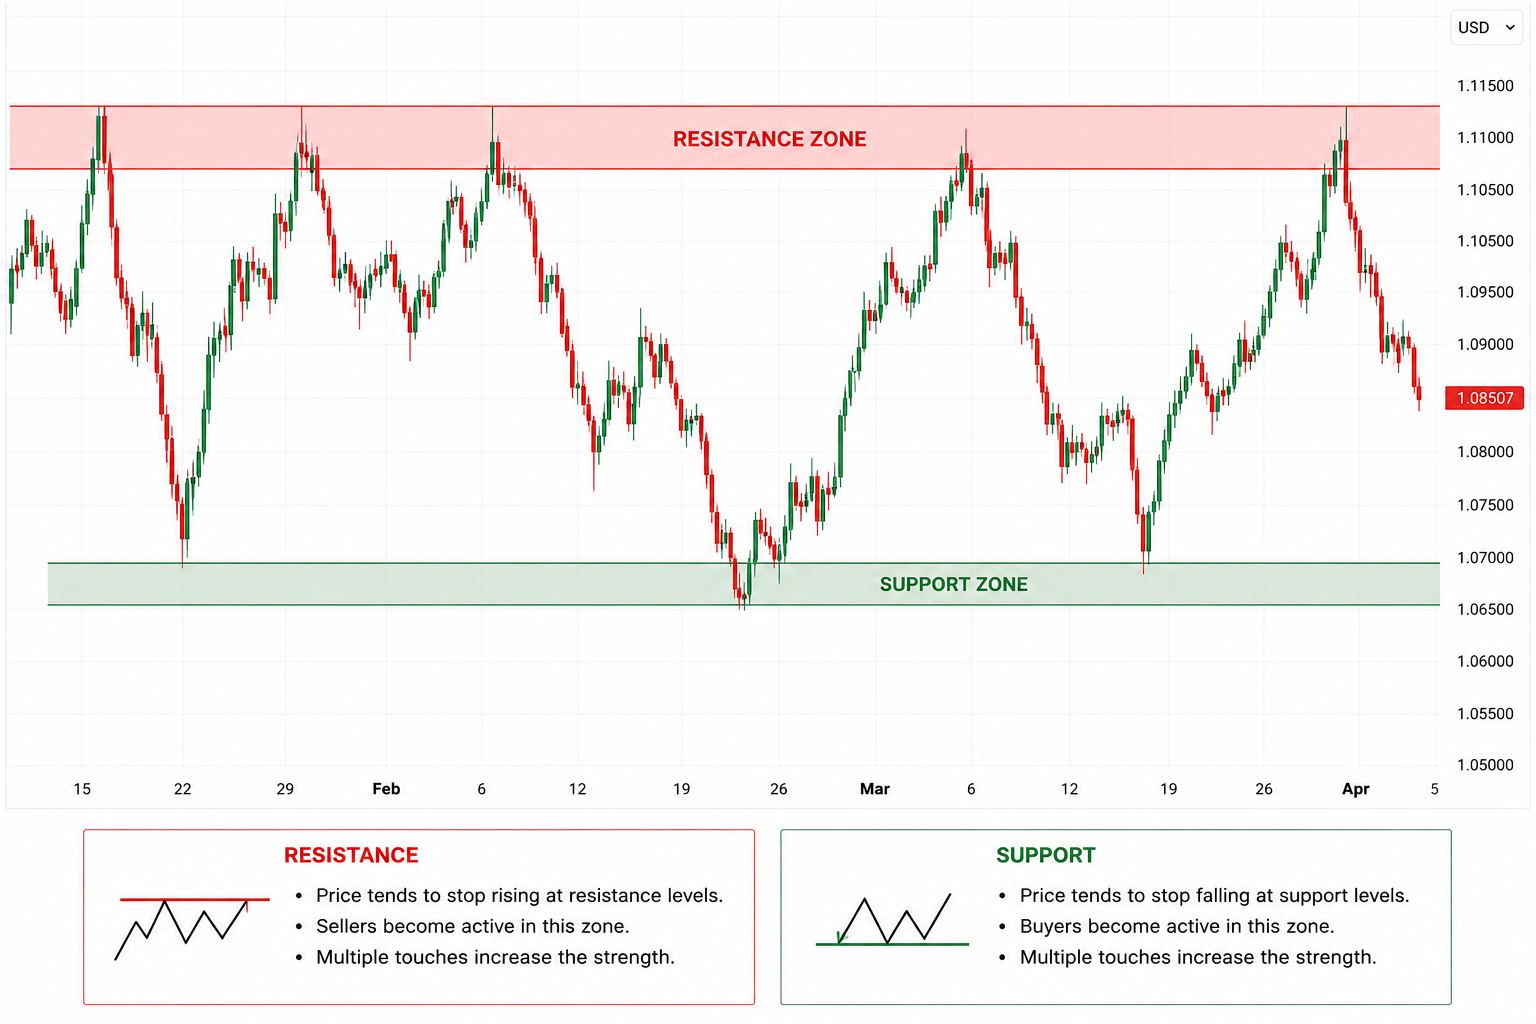
Think of Support and Resistance as the floor and ceiling of a room in which price is bouncing around like a rubber ball.
A. Support (The Floor / Buy Zone)
- Definition: A price level below the current market price where buying interest is strong enough to overcome selling pressure.
- Market Behavior: As price drops toward a support level, buyers step in expecting a bounce (“buy low”). This demand prevents price from falling further and pushes it back up.
B. Resistance (The Ceiling / Sell Zone)
- Definition: A price level above the current market price where selling interest is strong enough to overcome buying pressure.
- Market Behavior: As price rises toward a resistance level, sellers step in expecting a reversal (“sell high”). This supply prevents price from rising further and pushes it back down.
2. Dynamic Role Reversal (The Principle of Polarity)
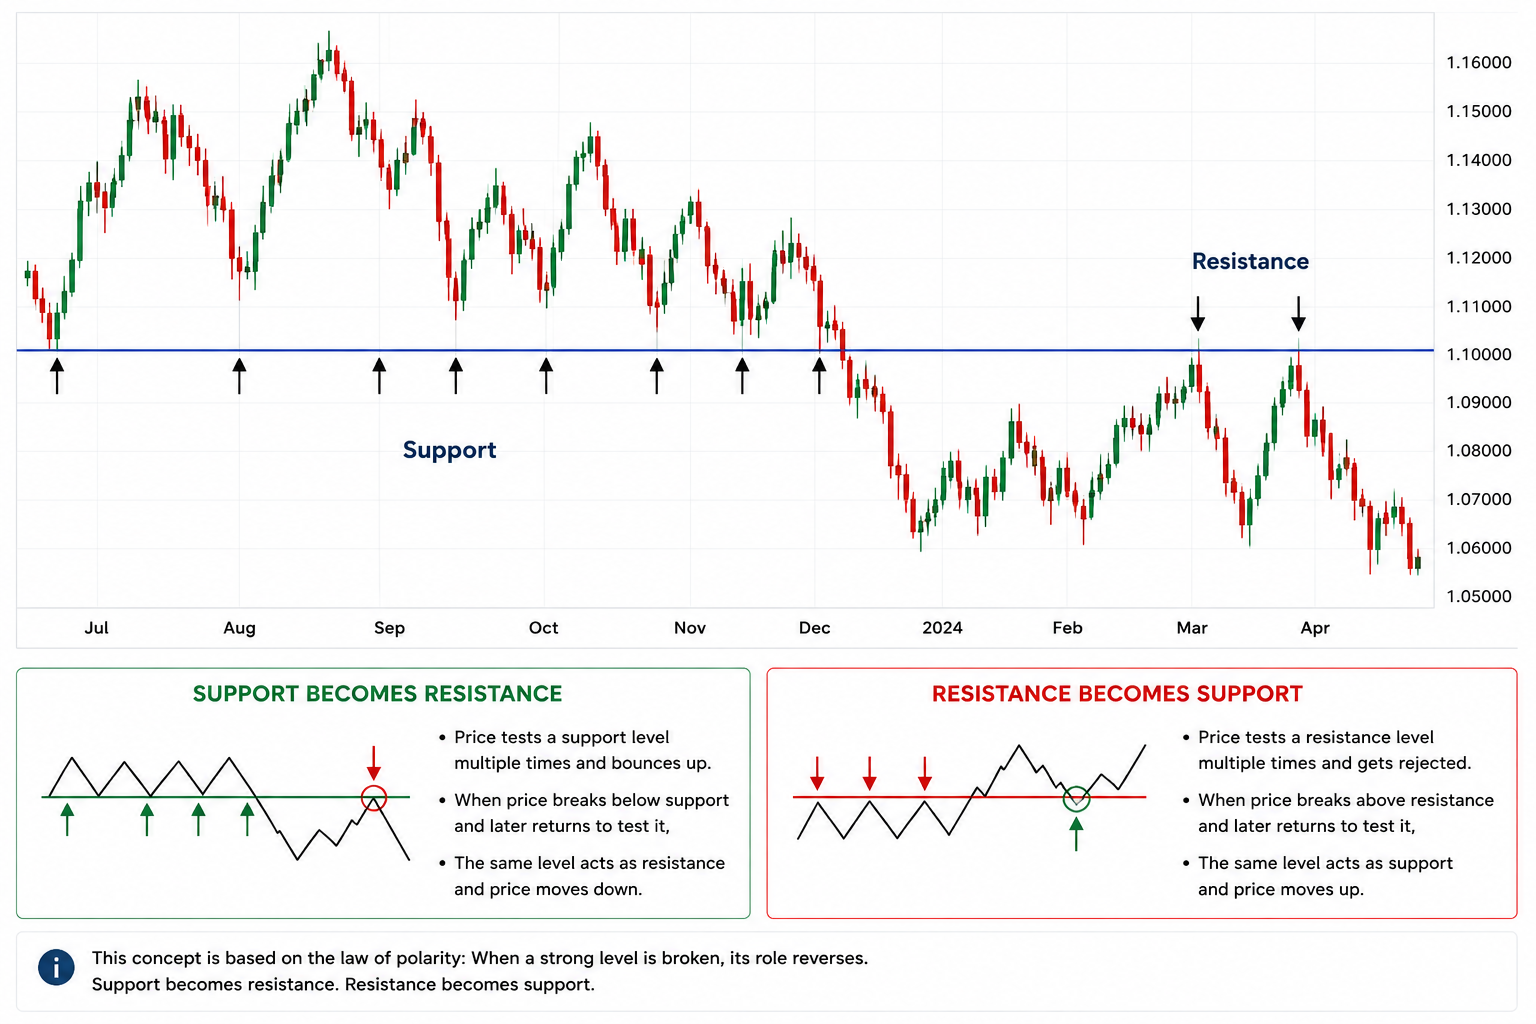
Here is one of the most powerful concepts in trading: Once a Support or Resistance level is broken, its role completely reverses.
- Broken Support becomes the New Resistance.
- Broken Resistance becomes the New Support.
Why Does This Happen? (The Psychology)
Imagine traders who sold short at a Resistance level. If price breaks out above that resistance, those short traders are suddenly trapped in losing positions. To exit their trades, they must buy back in. When price eventually pulls back down to that broken level, those trapped traders use the opportunity to buy and close their trades. This wave of buying creates fresh demand, turning the old ceiling into a new floor.
3. Levels vs. Zones (Avoid the Single-Line Trap)
A common mistake made by beginners is drawing Support and Resistance as razor-thin, single price lines (e.g., exactly 1.08500). In real trading markets, price rarely turns around at an exact single decimal point. Instead, Support and Resistance function as price zones or bands.
4. How to Identify & Draw Strong Key Levels
Not all levels are created equal. Use these 4 guidelines to find high-probability Support and Resistance zones:
Look for points where price changed direction aggressively. Sharp reversals signal heavy institutional interest.
The more times price tests a level and bounces, the more obvious it is to the global market.
Levels drawn on Daily (D1) and 4-Hour (H4) charts carry significantly more weight than 5-minute levels.
Institutions often place orders at psychological round numbers (e.g., 1.1000, 1.2000).
Summary Key Takeaways
- Support is a floor (buying zone); Resistance is a ceiling (selling zone).
- Roles reverse after a break: Broken Resistance becomes New Support, and broken Support becomes New Resistance (due to trapped traders).
- Draw zones, not exact lines: Account for market noise by marking price bands rather than a single coordinate.
- Higher timeframes dominate: Always map out your key levels on D1 and H4 charts before executing on lower timeframes.